Whole day
What it is: every meeting today on one timeline. Each row is a meeting, each little block is a race, and each dot is one runner.
Why it helps: you can see the whole day at a glance — what’s jumping soon, and where bookie prices are standing out.
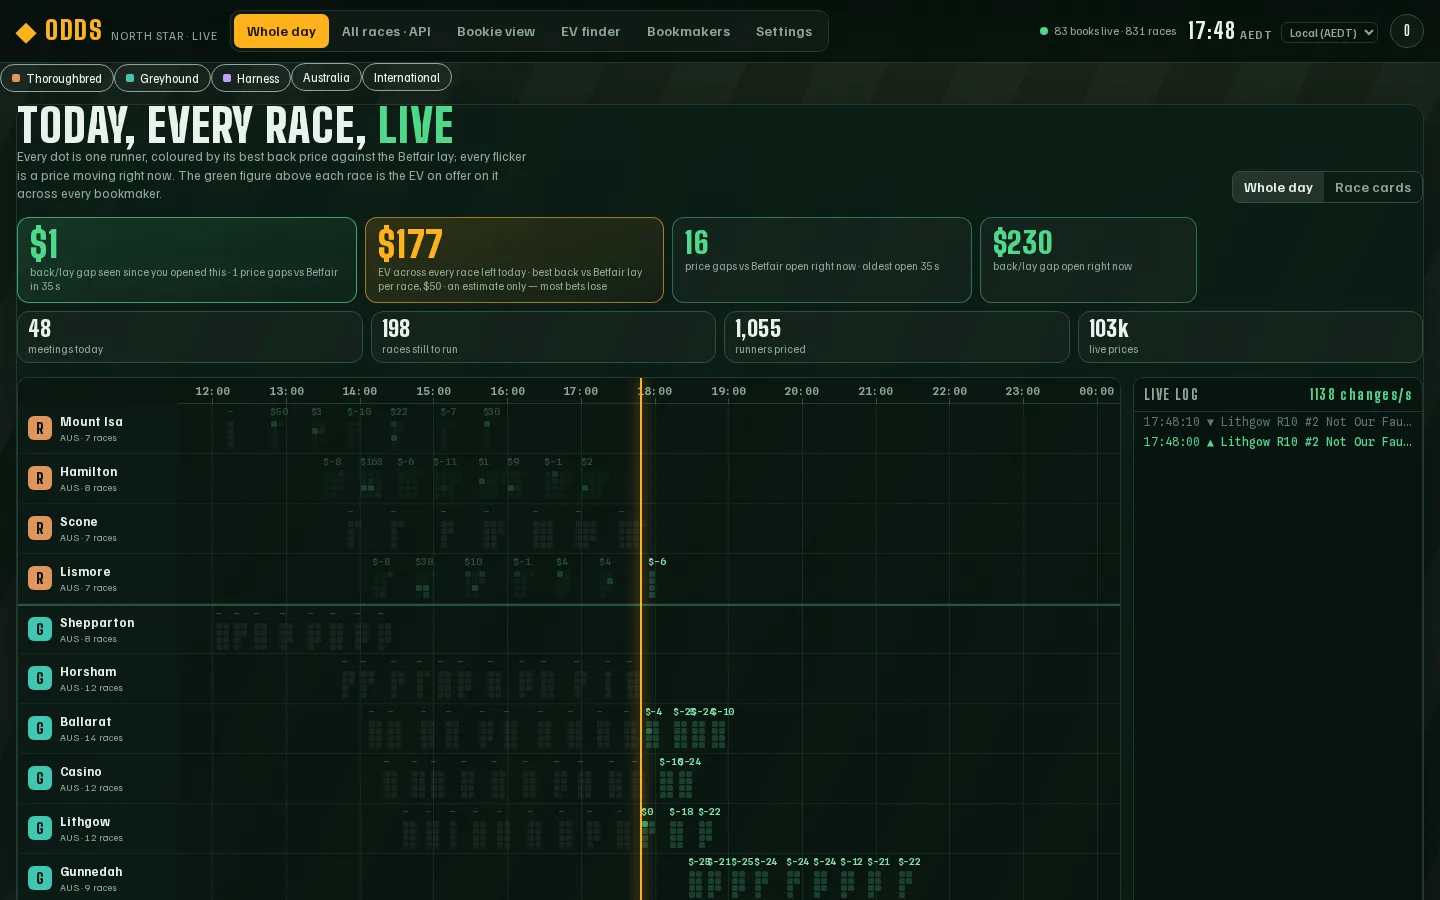
What the colours mean
Section titled “What the colours mean”- Brighter green dot: a bookie’s price on that runner is above Betfair’s price.
- Dull green dot: bookie prices are close to or under Betfair’s.
- Grey dot: Betfair has no price yet, so there’s nothing to compare against.
- Faded block: the race has already jumped.
- Amber line: the time right now.
The small figure above each race is the EV estimate for it.
An estimate only — most bets lose. See EV finder for what it means.
The Live log on the right lists prices as they move.
Open a race
Section titled “Open a race”- Find the race on the timeline.
- Click its block of dots.
- The race opens with every bookie’s price. See Reading a race.
Race cards
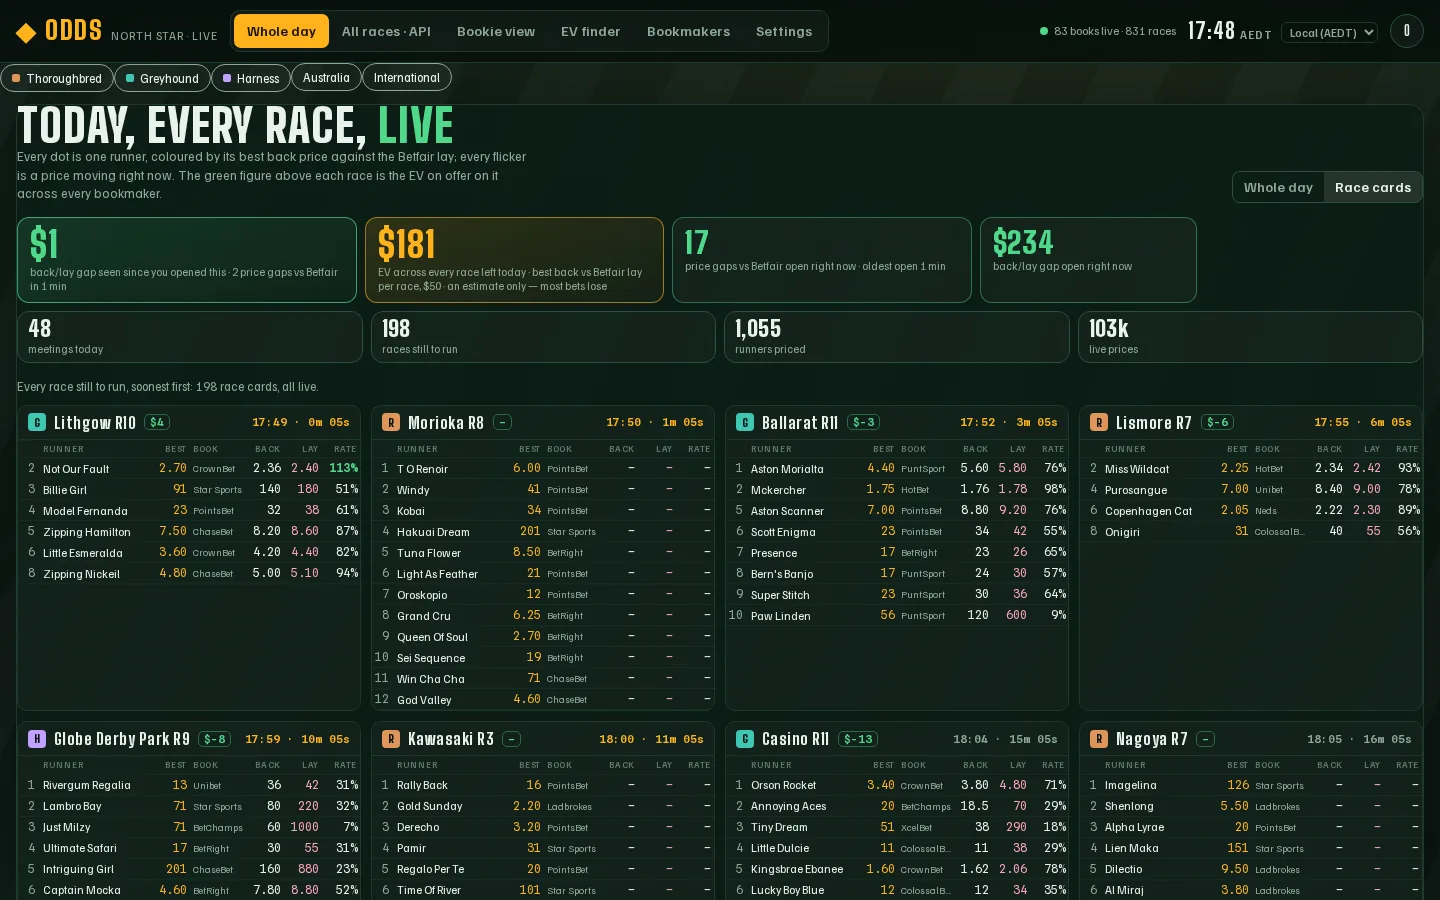
Section titled “Race cards”Prefer a list? Press Race cards (top right) to see each race as a card instead. Click a meeting name on the left to jump straight to its cards.
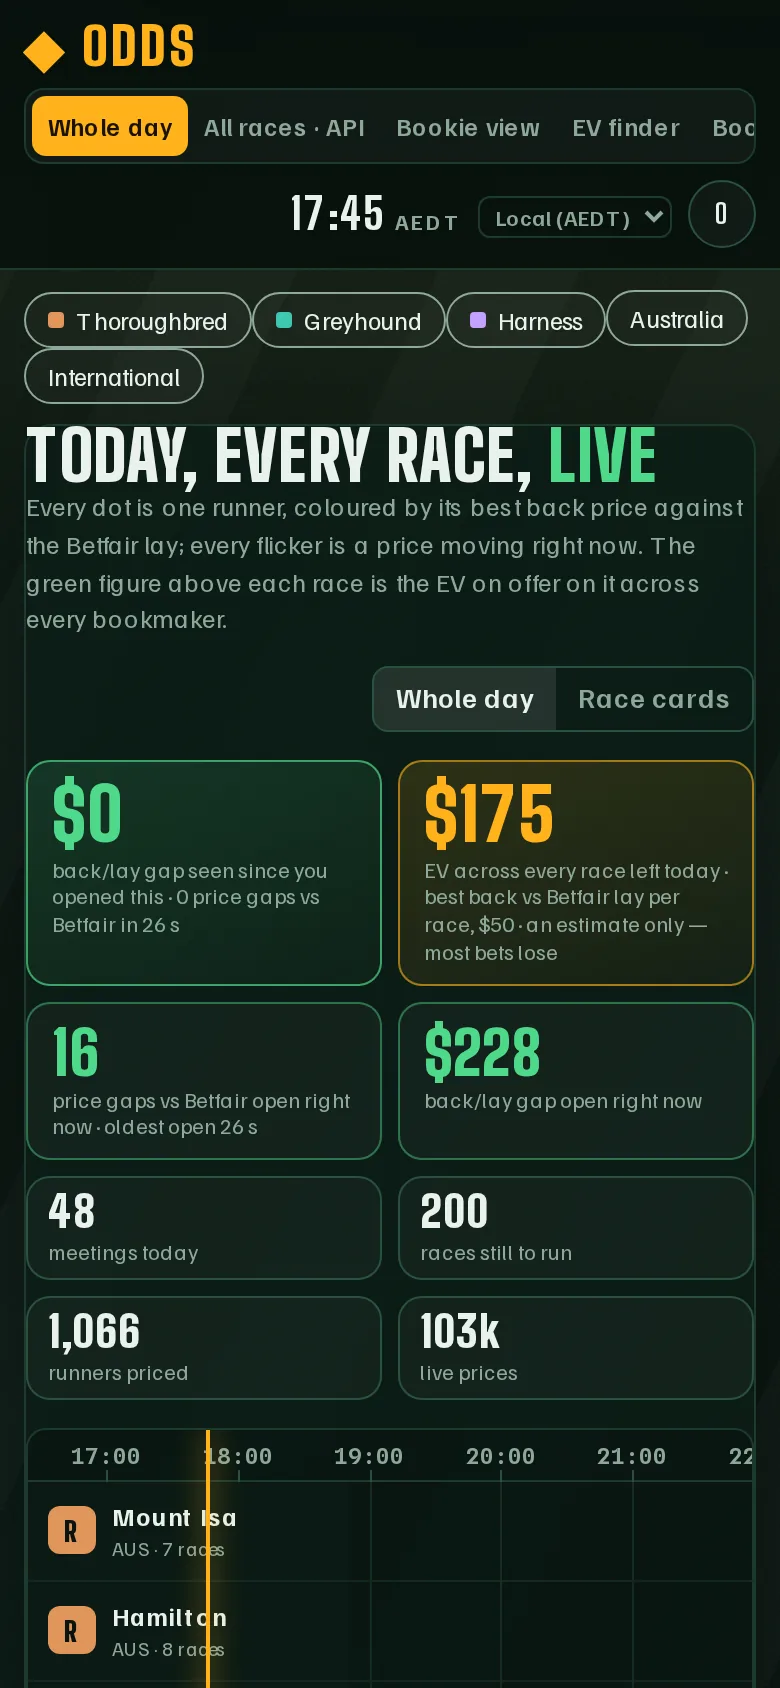
On your phone
Section titled “On your phone”On a phone the timeline is narrower — swipe sideways to move through the day.
Odds compares prices only. It is not a bookmaker, takes no bets and does not tell you what to back. Prices come from licensed Australian bookmakers' public sites and can change at any moment; always check the price with the bookmaker before you bet.
18+ · Chances are you're about to lose. For free and confidential support call 1800 858 858 or visit gamblinghelponline.org.au